
4. Findings
4.1 Income Status of Lone-Parent Families Footnote 15
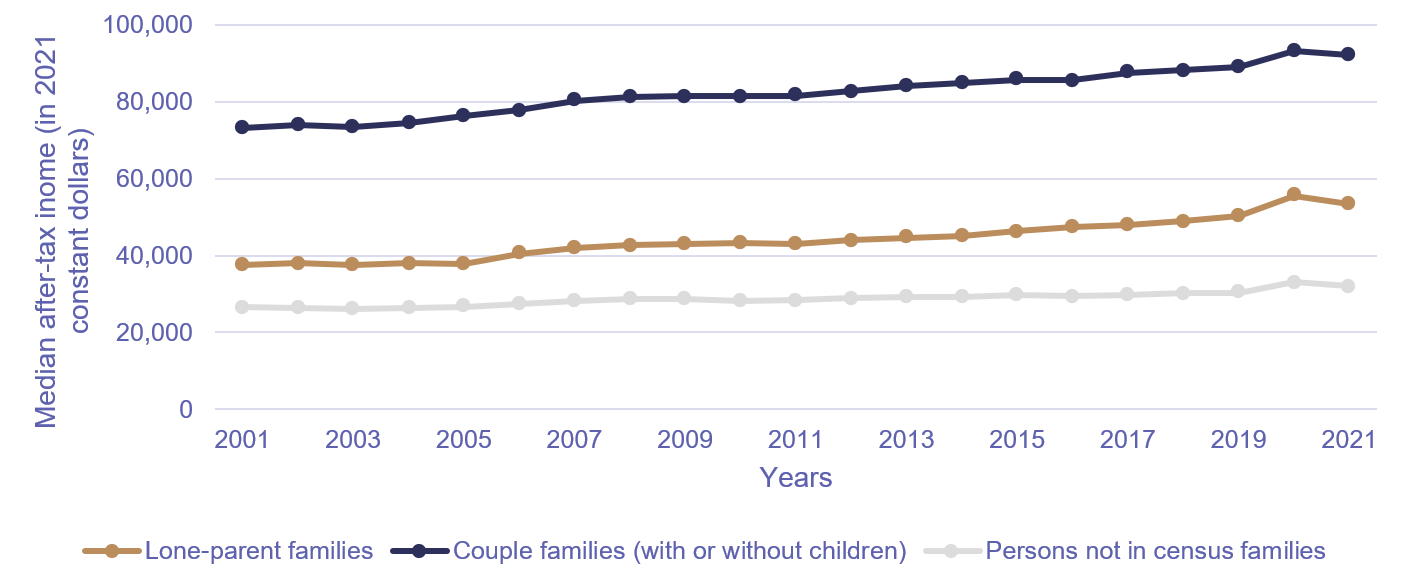
The after-tax median family income for lone parentsFootnote 16 between 2001 and 2021 rose from $37,601 to $53,440 in constant 2021 dollarsFootnote 17, an increase of 42%. The income growth experienced by lone-parent families outpaced all types of couple families with children, including those with one child (+36% for lone-parent families with one child compared to +31% for couple families with one child), with two children (+47% compared to +42%), and with three or more children (+60% compared to +38%). However, despite their higher income growth, lone-parent families continued to earn less than couple families with or without children, who saw their median income rise from $73,203 in 2001 to $92,140 in 2021.Footnote 18
While lone-parent families’ median after-tax income was consistently lower than couple families’, they earned more than persons not in census families. Persons who are not in census families experienced the lowest income growth, rising 21% between 2001 ($26,510) and 2021 ($32,130).
As shown in Chart 1 (and Table 1), lone-parent families experienced significant income growth from 2001 to 2021, with the largest year-over-year increases in 2006 and 2020, 7% and 11%, respectively. In comparison, the median after-tax family income of couple families with or without children grew by 2% in 2006 from 2005, with their highest year-over-year growth occurring in 2020, rising 5% from 2019. In 2021, the median after-tax family income of lone-parent families declined by 4% while that of couple families, with or without children, decreased by 1%. See Section 5 for a discussion on the changes in after-tax median family income.
Chart 1. Median after-tax family income of census families by family type with or without children, Canada, 2001 to 2021, Annual Income Estimates for Census Families and Individuals (T1 Family File)
Text version
This line chart presents the median after-tax income for three types of family units in Canada over a 21-year period from 2001 to 2021. The vertical axis (y-axis) displays the median after-tax income in 2021 constant dollars ranging from $0 to $100,000, while the horizontal axis (x-axis) marks each year from 2001 to 2021.
There are three distinct lines, each representing a different family type:
- Couple families (with or without children): This line begins at $73,203 in 2001 and shows a steady upward trend, reaching $93,332 by 2020. In 2021, the line decreases to $92,140. This group consistently has the highest median after-tax income among the three family types.
- Lone-parent families: This line starts at $37,601 in 2001 and gradually increases to $55,606 in 2020, before decreasing to $53,440 in 2021. It shows moderate growth over the two decades.
- Persons not in census families: This line begins at $26,510 in 2001 and shows a slight increase over time, reaching its highest in 2020 at $33,085 before ending at $32,130 in 2021. This group has the lowest and least variable income over time.
Note: The conversion into 2021 dollars was conducted using: Statistics Canada. n.d.-d. Table 18-10-0005-01 – Consumer Price Index, annual average, not seasonally adjusted.
Source: Statistics Canada, n.d.-c. Table 11-10-0017-01 – Census Families by Family Type and Family Composition Including Before and After-tax Median Income of the Family.
Low-Income Status Footnote 19
As shown in Chart 2 (and Table 2), lone-parent families experienced a reduction in low-income status, with the proportion of those living in low income decreasing nine percentage points between 2001 and 2021. The proportion of couple families, with or without children, living in low income also decreased (-2 percentage points). Conversely, the proportion of persons not in a census family living in low income increased by five percentage points. During the 21-year period, lone-parent families with three children or more experienced the largest percentage point reduction in low-income status (-15 percentage points) compared to all other family types. In comparison, the proportion of couple families with three or more children living in low income decreased by 7 percentage points.Footnote 20
Lone-parent families had the highest proportion of families living in low income between 2001 (41%) and 2018 (36%) compared to couple families with or without children and persons not in a census family. Lone-parent families experienced their second largest year-over-year decrease (-3 percentage points) in low-income status between 2005 and 2006. Additionally, between 2015 and 2019, lone-parent families generally experienced year-over-year decreases in the proportion living in low income. In particular, in 2016, the proportion of lone-parent families living in low income decreased by 2 percentage points from 2015. Within the same timeframe (2015 to 2019), persons not in a census family experienced a 1 percentage point increase in the proportion living in low income. In 2019, the proportion of persons not in a census family who were living in low income was the same as lone-parent families (35%). All three groups experienced their greatest reduction in low-income status in 2020, with the proportion of low-income lone-parent families decreasing by 7 percentage points, couple families (with or without children) by 2 percentage points, and persons not in a census family by 4 percentage points compared to the previous year. See Section 5 for a discussion around the change in low-income status.
Chart 2. Proportion of census families living in low income by family type with or without children, based on Census Family Low Income Measure After-tax (CFLIM-AT), Canada, 2001 to 2021, Annual Income Estimates for Census Families and Individuals (T1 Family File)

Text version
This line chart shows the percentage of families living in low income in Canada from 2001 to 2021, based on the Census Family Low Income Measure After-tax (CFLIM-AT). The vertical axis (y-axis) shows the proportion of families in low income, ranging from 0% to 50%, while the horizontal axis (x-axis) spans the years 2001 to 2021.
The chart includes three lines, each representing a different family type:
- Lone-parent families: This group consistently shows the highest proportion of families living in low income. In 2001, the rate is 41%, with a gradual decline over time. A notable drop occurs in 2020, bringing the rate to 28%, before increasing to 32% by 2021.
- Persons not in census families: The low-income rate for this group starts at 29% in 2001 and shows minor increases over the years, decreasing slightly in 2020 to 31%, before increasing to 34% by 2021.
- Couple families (with or without children): This group has the lowest proportion of families in low income, remaining relatively stable compared to the other family types. In 2001, the low-income rate is 10%. The rate decreases to 7% in 2020 before increasing to 8% in 2021.
Source: Statistics Canada. n.d.-b. Table 11-10-0018-01 – After-tax low income status of tax filers and dependants based on census family low income measure (CFLIM-AT), by family type and family type composition.
Impact of AgeFootnote 21
Between 2001 and 2021, the average age of lone parents increased, driven by decreases in the number of those aged 24-years-old and younger (-54%) and 25 to 34-years-old (-16%). Compared to all other age brackets, the number of lone parents between the ages of 55 to 64 saw the largest increase, rising 110% over the 21-year period (from 7% of all lone parents in 2001 to 14% in 2021).
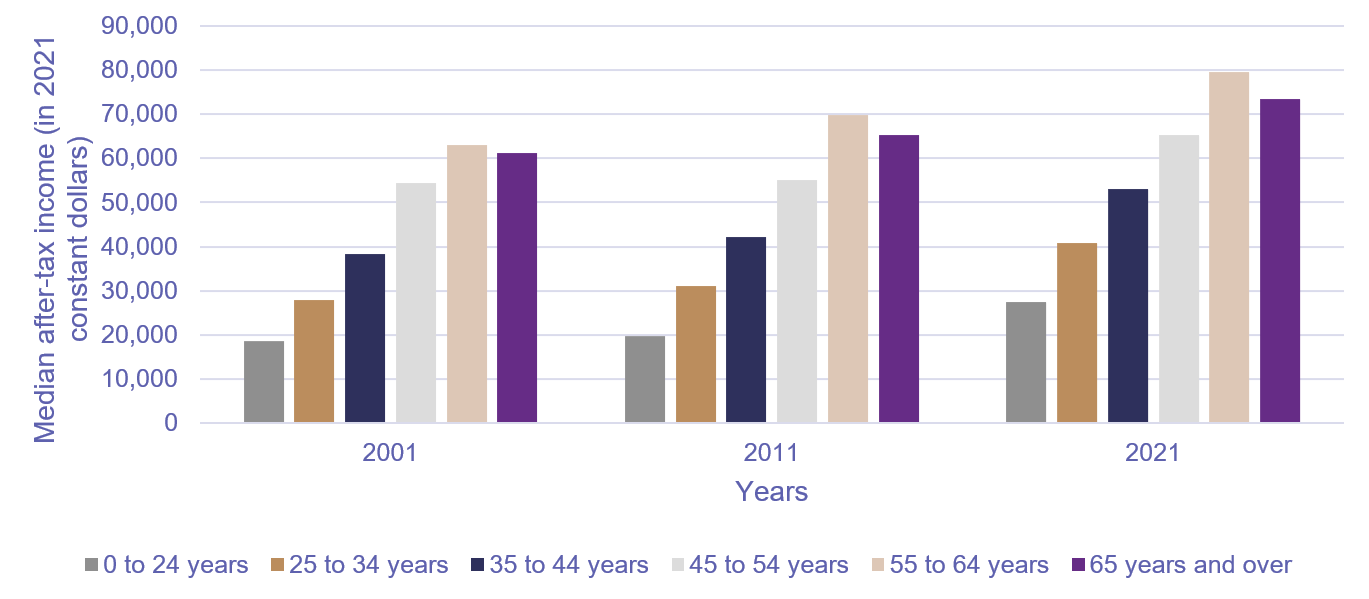
As seen in Chart 3 (and Table 3), the median after-tax income of 55 to 64-year-old lone parents in constant 2021 dollars increased from $62,982 in 2001 to $79,560 in 2021, and lone parents within this age bracket consistently had the highest median income. Additionally, lone parents aged 35 to 44 years old and 45 to 54 years old accounted for more than half (53%) of all lone-parent families in 2021. Both age groups increased their median income from 2001 to 2021 (+38% for lone parents 35 to 44 years old and +20% for lone parents 45 to 54 years old). In comparison, lone parents 24-years-old or younger had a lower median after-tax income, which was $18,533 in 2001 and $27,430 in 2021. However, this age bracket saw the largest increase in their median after-tax income (+48%).
The number of couple families (with or without children) in which the older partner was in the 55 to 64-year-old age bracket also saw a large increase compared to younger age brackets, rising 50% from 16% of all couple families in 2001 to 20% in 2021. However, unlike lone parents, couple families in the 55 to 64-year-old age bracket did not have the highest median income, as the age bracket with the highest median family income for couple families with or without children was those where the older partner was between 45 and 54-years-old ($140,290 compared to $125,120 for those aged 55 to 64 years old in 2021). The age bracket of couple families (with or without children) that saw the largest increase in median after-tax income in constant 2021 dollars also differed from that of lone parents, with couple families aged 55 to 64 years old reporting the largest increase (+38%). Similar findings were reported among persons not in a census family, as the number of those aged 55 to 64 years increased by 96% between 2001 and 2021, and this age bracket had the largest increase in median income over this time period (+35%). The exception was that younger adults not in a census family (aged 35 to 44 years) had the highest median income instead of older age groups in comparison to couple families and lone-parent families. In contrast to lone-parent families and couple families with or without children, the highest median income of persons not in a census family was reported amongst a younger age bracket of 35-to-44-years-old (at $43,291 in 2001 and $50,620 in 2021).
Chart 3. Median after-tax family income of census lone parents by age bracket, Canada, 2001, 2011 and 2021, Annual Income Estimates for Census Families and Individuals (T1 Family File)
Text version
This vertical bar chart shows the median after-tax income of census lone parents in Canada, broken down by age group for the years 2001, 2011, and 2021. The vertical axis (y-axis) indicates the median after-tax income in 2021 constant dollars, ranging from $0 to $90,000, and the horizontal axis lists the three years: 2001, 2011, and 2021. For each year, there are six bars, each representing a different age bracket of lone parents: 0 to 24 years; 25 to 34 years; 35 to 44 years; 45 to 54 years; 55 to 64 years; and 65 years and over.
- 2001: Lone parents aged 0 to 24 have a median income of $18,533 and those aged 25 to 34 have a median income of $27,944. Lone parents aged 35 to 44 have a median income of $38,368 and those aged 45 to 54 have a median income of $54,439. Lone parents aged 55 to 64 have a median income of $62,982 and those aged 65 years and older have a median income of $61,244.
- 2011: Lone parents aged 0 to 24 have a median income of $19,652 and those aged 25 to 34 have a median income of $31,119. Lone parents aged 35 to 44 have a median income of $42,197 and those aged 45 to 54 have a median income of $54,987. Lone parents aged 55 to 64 have a median income of $69,725 and those aged 65 years and older have a median income of $65,261.
- 2021: Lone parents aged 0 to 24 have a median income of $27,430 and those aged 25 to 34 have a median income of $40,910. Lone parents aged 35 to 44 have a median income of $53,040 and those aged 45 to 54 have a median income of $65,230. Lone parents aged 55 to 64 have a median income of $79,560 and those aged 65 years and older have a median income of $73,310.
Note: The conversion into 2021 dollars was conducted using: Statistics Canada. n.d.-d. Table 18-10-0005-01 – Consumer Price Index, annual average, not seasonally adjusted.
Source: Statistics Canada. n.d.-e. Table: 11-10-0012-01 – Distribution of total income by census family type and age of older partner, parent or individual.
Impact of GenderFootnote 22
Lone-parent families have been, and continue to be, headed primarily by women. In 2001, 84% of lone parents were women and 16% were men. However, between 2001 and 2021, the number of male lone-parent families grew by 49%, with 22% of lone parents in 2021 being male, while the number of their female counterparts declined by 0.4%.
Data from the T1 Family File provide income estimates disaggregated by gender. These data show that female lone-parent families continue to bring in considerably lower incomes than their male counterparts. As seen in Chart 4 (and Table 4), female lone-parent families had a median total income of $36,920 in 2001 and $53,500 in 2021, compared to $56,177 in 2001 and $72,590 in 2021 for male lone-parent families.
Despite this ongoing income disparity, female lone-parent families experienced a higher growth in median income (45%) than male lone-parent families (29%) between 2001 and 2021. The highest year-over-year income growth experienced by female lone parents since 2001 was in 2020, when their median total income rose by 13% from 2019, while that of male lone parents increased by 7%. Policies implemented to slow the spread of COVID-19 may explain this discrepancy, as women’s jobs accounted for 62.5% of overall employment losses at the onset of the pandemic in March 2020.Footnote 23 While this would initially appear to have a negative impact on female lone parents, the introduction of COVID-19 relief benefits more than offset declines in market income, resulting in an overall rise in income.Footnote 24 As more women began to re-enter the workplace in 2021, the median total income of female lone parents fell by 4% compared to the previous year. Meanwhile, male lone parents’ median total income declined by 2%.
Chart 4. Median total income of census lone-parent families by gender, Canada, 2001 to 2021, Annual Income Estimates for Census Families and Individuals (T1 Family File)

Text version
This line chart presents the median total income of census lone-parent families in Canada from 2001 to 2021.The vertical axis (y-axis) shows the median total income values in 2021 constant dollars ranging from $0 to $80,000, while the horizontal axis (x-axis) spans the years 2001 to 2021.
The chart includes three lines, each representing a different category of lone-parent families:
- Female lone-parent families: This line begins at $36,920 in 2001 and shows a gradual upward trend, reaching $55,885 in 2020, before decreasing to $53,500 in 2021.
- Male lone-parent families: This line starts at $56,177 in 2001 and increases steadily over time, reaching $74,087 by 2020, before declining to $72,590 in 2021. This group consistently has the highest median income compared to all lone-parent families and female lone-parent families.
- Total lone-parent families: Represented with a dashed line, this line starts at $39,382 in 2001 and follows an upward trajectory, reaching a high of $58,976 in 2020 before ending at $56,750 in 2021.
Note: The conversion into 2021 dollars was conducted using: Statistics Canada. n.d.-d. Table 18-10-0005-01 – Consumer Price Index, annual average, not seasonally adjusted.
Source: Statistics Canada. n.d.-f. Table 11-10-0011-01 – Census families by age of older partner or parent and number of children.
4.2 Sources of Income of Lone-Parent Families
The total income of Canadian families is comprised of funds from various sources, including market income and government transfers. Combined, the dollar value of these income sources increased the median total income of lone parents. The following section presents data trends in all three income sources between 2001 and 2021.
Median Market IncomeFootnote 25
A family’s market income is calculated through the sum of earnings (from employment and net self-employment), net investment income, private retirement income, and other income from market sources; it is also called income before taxes and transfers.Footnote 26 In terms of employment income, lone parents in 2019 brought in substantially higher amounts compared to 2001, as their rate of employment steadily increased. The employment rate of female lone parents and male lone parents, aged 25 and older with at least one child under the age of 18, increased by 7% each, from 70% and 79% in 2001 to 75% and 85% in 2019, respectively.Footnote 27
As previously mentioned, (see “Impact of Gender”), national employment rates plummeted in 2020 during the COVID-19 pandemic, with female lone parents taking on the brunt of job losses. Between February and May 2020, the first wave of the pandemic, the rate of employed female lone parents, aged 25 and older with at least one child under the age of 18, decreased by 16%, compared to a decrease of 13% for male lone parents.Footnote 28 At the same time, the employment rate of couple families where both parents were employed and with at least one child under the age of 18 declined by 6%. During the same period, couple families were significantly more likely than lone parents to have voluntarily left their employment,Footnote 29 which may be due to the closure of schools and childcare facilities.Footnote 30 Lone parents may not have left their employment voluntarily in as high of proportion as couple families, as they are more likely to have lower incomes and be living in low income. Lone parents also do not have the financial and emotional support from a partner that could make it easier and more affordable for them to leave their employment voluntarily. However, across all family types, employment rates in 2021 were closer to those observed in 2019.Footnote 31
Between 2001 and 2021, lone parents saw the largest proportional increase in median market income. As shown in Chart 5 (and Table 5), the median market income of female lone parents rose by 51% while that of male lone parents increased by 46%. Comparatively, median market income rose by 23% for couples with childrenFootnote 32 and 33% for persons under 65 years and not in an economic family. However, despite having the lowest proportional increase, couples with children had a median market income approximately three times higher than female lone parents and 1.5 times higher than male lone parents in 2021.
In 2020, female lone parents’ median market income dropped by 10% from 2019, male lone parents’ by 11%, couples with children by 2%, and persons not in an economic family by 8%. However, the median market income of all groups in 2021 was higher than before the COVID-19 pandemic in 2019. From 2020 to 2021, the median market income rose by 13% for female lone parents, 17% for male lone parents, 2% for couples with children, and 24% for persons not in an economic family.
Chart 5. Median market income, before taxes and transfers, by economic family type for non-senior families, Canada, 2001 to 2021, Canadian Income Survey

Text version
This line chart displays the median market income (before taxes and transfers) for various non-senior family types in Canada from 2001 to 2021. The horizontal axis (x-axis) represents the years from 2001 to 2021. The vertical axis (y-axis) shows the median market income in 2023 constant dollars, ranging from $0 to $140,000.
There are four lines in the chart, each representing a different economic family type:
- Couples with children: This line begins at $104,700 in 2001, rising steadily to $128,700 by 2021. This line declines twice over the 21-year period, from $124,400 to $122,200 between 2015 and 2016 and from $128,400 to $126,000 between 2019 and 2020. This group consistently has a higher median market income compared to lone-parent families and persons not in an economic family.
- Male lone-parent families: This line starts at $57,400 in 2001 and fluctuates over time, before reaching $83,800 by 2021. The largest declines are between 2010 and 2011 (from $65,900 to $57,400), between 2015 and 2016 (from $69,300 to $64,800), and between 2019 and 2020 (from $80,300 to $71,400).
- Female lone-parent families: This line begins at $29,100 in 2001 and shows a slight increase over time, reaching $44,000 by 2021. This line has two notable decreases from $29,100 in 2001 to $24,400 in 2002 and from $43,100 in 2019 to $38,800 in 2020.
- Persons not in an economic family: This line starts at $34,200 in 2001 and remains relatively stable over the 21-year period, reaching $36,700 in 2020. In 2021, the line increases to $45,500.
Source: Statistics Canada. n.d.-g. Table 11-10-0190-01 – Market income, government transfers, total income, income tax and after-tax income by economic family type, Canadian Income Survey.
Government TransfersFootnote 33
Government transfers are usually established to smooth out the impact of market income volatility for all family types. As shown in Chart 6 below, government transfers play an important role in lone parents’ financial wellbeing. In Canada, government transfers are delivered through a range of benefits including social assistance benefits, federal child benefits, and Employment Insurance.
Between 2001 and 2021, female lone-parent families continuously had the highest median amount in government transfer income, followed by male lone-parent families, couples with children, and persons not in an economic family. These findings are likely attributable to the range of child benefits available to parents, and between 2001 and 2021, lone parents consistently had a higher median for government transfers than couples with children. Within the 21-year period, the median dollar amount of child benefits for lone-parent families was, on average, $2,800 higher per year (or 1.8 times higher) than that of couples with children.Footnote 34 For all types of government transfers, the median for lone parents was on average $6,300 higher per year (or 1.9 times higher) than for couples with children. Overall, lone-parent families were more economically dependent on the government transfers they received during the 21-year period. In fact, the economic dependency ratio of lone-parent families, which compares government transfer payment dollars received as benefits with every $100 earned through employment income, was higher than couple families during the 21-year period. For instance, the median economic dependency ratio for lone-parent families was $37.80 in government transfers for every $100 earned, whereas the median ratio was $12.70 in government transfers for every $100 earned by couple families.Footnote 35
Chart 6 shows notable increases in government transfer income for both lone-parent families and couples with children, with the most significant increase for both family types occurring in 2020 (see also Table 6). However, there was variation in the annual increases experienced by each family type and gender. For example, in 2015, couples with children experienced their second greatest year-over-year increase in median government transfer income (37%) during the 21-year period, and although it was similar for male lone-parent families (33%), the increase in 2015 was less significant for female lone-parent families (11%). Among male lone-parent families, their second greatest per-year increase was in 2013 (62%), and among female lone-parent families, their second greatest annual increase was in 2009 (18%).
As mentioned above, all groups experienced their largest per-year increase in government transfer income in 2020. This is also when their economic dependency ratio reached its highest: $61.40 in government transfers for every $100 of earned by lone-parent families; $22.60 for every $100 earned by couple families; and $48.50 for every $100 earned by persons not in a census family.Footnote 36 The median government transfer income for couples with children increased by 107% from 2019 to 2020, for male lone parents by 96%, and for female lone parents by 69%. While the median government transfer income for persons not in an economic family and less than 65 years old remained fairly consistent throughout the 21-year period, 2020 was an exception, as their median government transfer income rose by 291%. In addition, between 2019 and 2020, the proportion of those living in low income declined by 20% for lone-parent families, 27% for couple families with or without children, and 11% for persons not in a census family.Footnote 37 However, the proportions of all family types living in low income rose between 2020 and 2021 following a decline in government transfers as COVID-19 pandemic lockdown restrictions began to be lifted. See Section 5.2 for a discussion on the impact of government transfers over the 21-year period.
Chart 6. Median government transfers by economic family type, for non-senior families, Canada, 2001 to 2021, Canadian Income Survey

Text version
This line chart displays the median government transfer income received by various non-senior family types in Canada from 2001 to 2021. The horizontal axis (x-axis) represents the years from 2001 to 2021. The vertical axis (y-axis) shows the median amount of government transfers in 2023 constant dollars.
There are four lines on the chart, each representing a different economic family type:
- Female lone parent families: This line shows a steady increase in median government transfers over time, starting at $10,600 in 2001. There is a notable spike between 2019 and 2020, from $17,100 to $28,900, before declining slightly to $21,900 in 2021.
- Male lone parent families: This line fluctuates with an overall upward trend between 2001 and 2021. This line begins at $5,500 in 2001, reaching a peak of $19,600 in 2020 before declining to $9,400 in 2021.
- Couples with children: This line starts at $3,200 in 2001 and reaches $19,000 by 2020, before decreasing to $14,900 in 2021.
- Persons not in an economic family: This line begins at $800 in 2001 and remains relatively stable over time, except for a large increase in 2020 to $4,300 before declining to $1,100 in 2021. This group consistently receives the lowest median government transfer amounts.
Source: Statistics Canada. n.d.-g. Table 11-10-0190-01 – Market income, government transfers, total income, income tax and after-tax income by economic family type.
Support PaymentsFootnote 38
Support payments are income derived from formal agreements for child support or spousal support. Data from the Canadian Income SurveyFootnote 39 show that female lone parents were considerably more likely to receive this form of income, with 29% receiving support payments in 2022, which is significantly different from the 5% of male lone parents who received these payments. Moreover, 96% of support payment recipients enrolled in a Maintenance Enforcement Program – a service that collects and enforces court-ordered support payments – were female, and 96% of payors were male.Footnote 40
Between 2012 and 2022, female lone-parent beneficiaries’ median support payment income remained stable at approximately $6,000 in constant dollars in 2012 and 2022. While data prior to 2022 for male lone parents are too unreliable to publish, in 2022, the median support payment income of male lone-parent beneficiaries was also $6,000.Footnote 41
As shown in Chart 7 (and Table 7), the median yearly support payments for all lone parents and female lone parents were comparable. The largest difference was reported in 2021, where female lone-parent beneficiaries received a median support payment approximately $450 higher than the amount reported for all lone parents (approximately $6,000 for female lone parents and $5,550 for all lone parents). It is important to note that the median support payment data may not include all child-related expenses paid by parents. The Federal Child Support Guidelines allow for discretion to be used in determining an appropriate child support amount in shared parenting arrangements, and results from the 2022 National Family Law Survey show that special or extraordinary expenses are rarely included in child support calculations.Footnote 42
Chart 7. Median yearly support payments for spousal and child support among lone parents and female lone parents in economic families, Canada, 2012 to 2022, Canadian Income Survey

Text version
This line chart presents the median yearly support payments received by total lone parents and female lone parents in economic families in Canada from 2012 to 2022. The horizontal axis (x-axis) represents the years from 2012 to 2022. The vertical axis (y-axis) shows the median yearly amount of support payments in 2022 constant dollars, ranging from $0 to $8,000.
The chart includes two lines, each representing a different category of lone parents:
- Total lone parents: This line begins at $5,964 in 2012 and fluctuates over the decade, reaching $6,000 by 2022. This line decreases to its lowest point at $4,802 in 2013 and reaches its highest at $6,671 in 2019.
- Female lone parents: This line fluctuates over time, starting at $5,964 in 2012 and ending at $6,000 in 2022. The most notable increase and decrease occur between two years, declining to a low of $4,925 in 2013 before reaching a high of $6,763 in 2014.
Note: The conversion into 2021 dollars was conducted using: Statistics Canada. n.d.-d. Table 18-10-0005-01 – Consumer Price Index, annual average, not seasonally adjusted.
Source: Statistics Canada. n.-d.-k. Canadian Income Survey, 2012 to 2022. Custom tabulation. Constant dollars calculated using: Statistics Canada. n.d.-d. Table 18-10-0005-01 – Consumer Price Index, annual average, not seasonally adjusted.
4.3 Income Status of Lone Parents with Intersectional Identities
Lone-Parent Families Headed by Persons with DisabilitiesFootnote 43
Previous research has shown that people with disabilities are more likely than people without disabilities to experience social exclusion and discrimination, resulting in unequal access to social, cultural, political, and economic resources.Footnote 44 Consequent financial difficulties can be compounded when a person with a disability is also a lone parent. This reality is of particular concern considering that, in 2011, women aged 15 years and older with disabilities were significantly more likely to be lone parents (11%) compared to non-disabled women aged 15 years and older (8%).Footnote 45
Lone parents with disabilities are also more likely than those without a disability to fall under the Market Basket Measure poverty threshold. As shown in Chart 8, approximately 40% of lone parents with disabilities were significantly more likely to be living in poverty in 2015 compared to 27% of those without disabilities. The proportion of lone-parent families living in poverty under the individual Market Basket Measure in 2015 was higher for lone parents with severe disabilities than for lone parents without disabilities (43% and 27%, respectively). In 2020, the proportion of lone parents with disabilities under the individual Market Basket Measure decreased substantially as it was less than half of the proportion in 2015 (18% in comparison to 40%). Similarly, in 2020, the proportion of lone parents without disabilities under the individual Market Basket Measure was about half that in 2015 (13% in comparison to 27%). The proportion of lone parents with disabilities (18%), particularly those with severe disabilities (23%), were significantly more likely to be living in poverty in 2020 than lone parents without disabilities (13%).
Chart 8. Proportion of economic lone-parent families living below the Individual Market Basket Measure by disability status and severity, Canada, 2015 to 2020, Canadian Survey on Disability

Text version
This horizontal bar chart presents the proportion of economic lone-parent families living below the Market Based Measure (MBM) threshold in 2015 and 2020 by disability status and severity. The horizontal axis (x-axis) displays the proportion of lone parents living below the MBM threshold, ranging from 0% to 50%. The vertical axis (y-axis) shows 4 groups of lone parents by disability status and severity: total lone parents with disabilities, lone parents with milder disabilities, lone parents with more severe disabilities, and lone parents without disabilities. For each group, there are two bars, each representing a year of data: 2015 and 2020.
- Total lone parents with disabilities: 40% of lone parents with disabilities in 2015 and 18% in 2020 were living below the MBM threshold.
- Lone parents with milder disabilities: 36% of lone parents with milder disabilities in 2015 and 14% in 2020 were living below the MBM threshold.
- Lone parents with more severe disabilities: 43% of lone parents with severe disabilities in 2015 and 23% in 2020 were living below the MBM threshold.
- Lone parents without disabilities: 27% of lone parents without disabilities in 2015 and 13% in 2020 were living below the MBM threshold.
Note: The percentage of lone parents with milder disabilities in 2015 (36%E) should be used with caution.
Source: Hébert, B.-P., Kevins, C., Mofidi, A., Morris, S., Simionescu, D. and Thicke, M. 2024. “A demographic, employment and income profile of persons with disabilities aged 15 years and over in Canada, 2022.”Statistics Canada Catalogue no. 89-654-X.
Lone-Parent Families Headed by ImmigrantsFootnote 46
According to the 2021 Census, lone parents with children aged 17 and younger were four times (26%) more likely to be living in low income than couples with children aged 17 and younger (7%). When looking at the data by immigration status, lone-parent families headed by an immigrant womanFootnote 47 with children under the age of 17 were most likely to be in low income (27%), followed by lone-parent families headed by a non-immigrant woman (24%), an immigrant man (21%) and a non-immigrant man (19%). The prevalence of low income amongst immigrant lone parents also varied according to their admission category. Low-income rates of immigrant female lone parents admitted under the economic category (25%) were comparable to those of non-immigrant female lone parents (24%), while they were higher among female lone parents admitted as a refugee (31%) or sponsored by family (27%).
Furthermore, established lone-parent immigrants who have been in Canada for more than five years have a lower prevalence of living in low income than recent lone-parent immigrants.Footnote 48 Among lone-parent families that were headed by an established immigrant woman, the prevalence of living in low income was similar to lone-parent families that were headed by a non-immigrant woman (25% and 24%, respectively). In contrast, the prevalence of low income among lone-parent families that were headed by a recent immigrant woman was much higher (39%). This finding for female lone parents was similar for male lone parents but to a lesser extent (established immigrant men, 21%; non-immigrant men, 19%; and recent immigrant men, 26%).
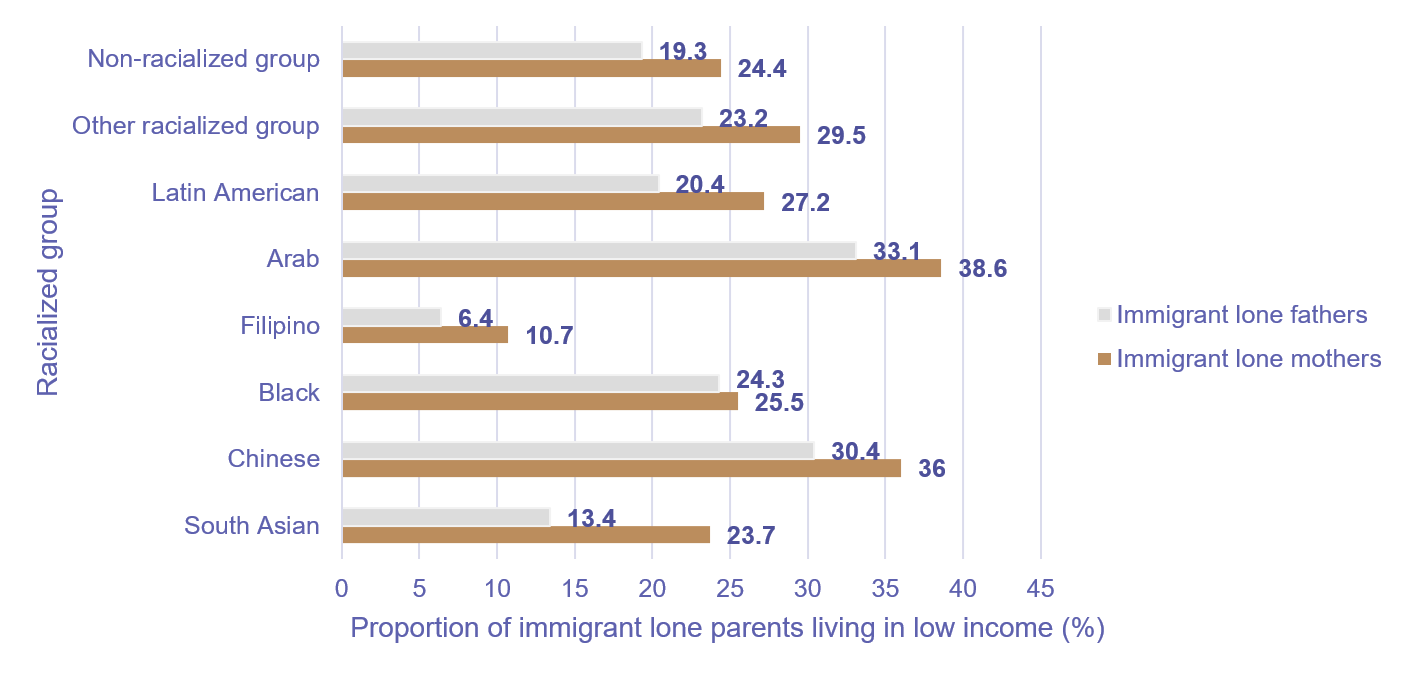
Additionally, low-income rates among racialized immigrant lone parents were not always higher compared to their non-racialized counterparts, with Chart 9 showing variations according to the parent’s racialized identity. For example, lone-parent families headed by a Filipino immigrant woman (11%) were less likely to be living in low income than lone-parent families headed by a non-racialized immigrant woman (24%). However, certain racialized immigrant groups were more likely to be lone parents living in low income, including Arab immigrant female (39%) and male parents (33%).
Chart 9. Proportion of low income (Census Low Income Measure After-Tax; LIM-AT) among persons in lone-parent families with children aged 17 years and younger and with an immigrant parent, by gender and racialized group of parents, Canada, 2021, Census of Population
Text version
This horizontal bar chart presents the proportion of immigrant lone-parent families living in low income in 2021 with children aged 17 and younger by racialized identity. The horizontal axis (x-axis) displays the proportion of immigrant lone parents living in low income, ranging from 0% to 45%. The vertical axis (y-axis) shows 8 groups of immigrant lone parents by racialized identity: non-racialized group, other racialized group, Latin American, Arab, Filipino, Black, Chinese and South Asian. For each group, there are two bars, one for immigrant lone fathers and one for immigrant lone mothers.
- Non-racialized group: 19% of immigrant lone fathers and 24% of immigrant lone mothers are living in low income.
- Other racialized group: 23% of immigrant lone fathers and 30% of immigrant lone mothers are living in low income.
- Latin American: 20% of immigrant lone fathers and 27% of immigrant lone mothers are living in low income.
- Arab: 33% of immigrant lone fathers and 39% of immigrant lone mothers are living in low income.
- Filipino: 6% of immigrant lone fathers and 11% of immigrant lone mothers are living in low income.
- Black: 24% of immigrant lone fathers and 26% of immigrant lone mothers are living in low income.
- Chinese: 30% of immigrant lone fathers and 36% of immigrant lone mothers are living in low income.
- South Asian: 13% of immigrant lone fathers and 24% of immigrant lone mothers are living in low income.
Note: The low-income data on immigrant lone-parent families focus on the persons in lone-parent families, as opposed to the family.
Source: Carpino, T. 2024. “Prevalence of low income among persons in one-parent families headed by an immigrant parent: An intersectional analysis.” Statistics Canada Catalogue no. 45-20-002.
Indigenous Lone-Parent Families Footnote 49
First Nations, Inuit, and Métis in Canada have long faced substantial economic disparities compared to their non-Indigenous counterparts.Footnote 50 In noting these disparities, it is crucial to acknowledge the long history of colonialism, displacement, discrimination, and marginalization that continue to have a profound impact on Indigenous peoples and their economic wellbeing.Footnote 51 In 2021, the overall population of Indigenous people living in the provincesFootnote 52 represented a higher proportion of those living below the individual Market Basket Measure poverty threshold than non-Indigenous people, sitting at 12% and 8%, respectively, although there was variation by Indigenous group with 14% among First Nations people living off reserve, 10% among Inuit and 9% among Métis.Footnote 53 Additionally, there were higher proportions of Indigenous lone parents than non-Indigenous representing 8% and 4% of their total populations.Footnote 54 When interpreting these data, it is important to remember that Indigenous people have a different perspective on families and many live in multigenerational home with their parents, grandparents or other family members. Although Indigenous people may be more likely to live in a lone-parent household, their family members, such as grandparents, often play an important role in helping to raise the children and pass down cultural traditions and knowledge.Footnote 55
As shown in Chart 10, based on the 2016 Census of PopulationFootnote 56, over one-quarter (26%) of First NationsFootnote 57 and 32% of MétisFootnote 58 who were lone parents were living in poverty, below the Market Based Measure threshold, compared to 23% of their non-Indigenous counterparts. First Nations women and Métis women in lone-parent families were also more likely to be living in poverty (30% and 35%, respectively) compared to their non-Indigenous counterparts (25%). For male lone-parent families, Métis men (22%) were more likely than non-Indigenous men (17%) to be living in poverty. The proportions of First Nations people and Métis who are lone parents living in poverty were two and four times higher, respectively, than the proportions of First Nations people and Métis who are lone parents (26% compared to 13% for First Nations people and 32% compared to 8% for Métis, respectively), and the proportion of non-Indigenous lone parents living in poverty (23%) was 4.5 times higher than the proportion of non-Indigenous lone parents (5%).Footnote 59 This means that non-Indigenous lone-parent families represented proportionally a larger percentage of those living in poverty, compared to First Nations and Métis lone-parent families. This difference was even more pronounced among Métis and non-Indigenous male lone parents, with the proportions of these lone parents living in poverty being 7 and 8.5 times higher, respectively, than their proportions as lone parents. Among Inuit, the proportion of lone parents living in poverty was 12% in 2016, however the Market Basket Measure for the three territories was not available at the time the data were prepared, and these data may exclude a large number of Inuit as 44% of Inuit lived in Nunavut and 4% lived in the Inuvialuit region (Northwest Territories) at the time of the 2016 Census of Population.Footnote 60
Chart 10. Proportion of lone parents in economic families living in the provinces and below the Individual Market Basket Measure by Indigenous identity and gender, Canada, 2016, Census of Population

Text version
This vertical bar chart presents the proportion of lone parents living below the Market Basket Measure (MBM) threshold in Canada in 2016 by gender and Indigenous identity. The horizontal axis (x-axis) displays three groups of lone parents by gender: female lone parents, male lone parents and total lone parents. For each group, there are four bars, each representing an Indigenous identity group: First Nations, Inuit, Métis and non-Indigenous people. The vertical axis (y-axis) shows the proportion of lone parents living below the MBM threshold, ranging from 0% to 40%.
- For female lone parents: 30% of First Nations, 13% of Inuit, 35% of Métis and 25% of non-Indigenous female lone parents in 2016 are living below the MBM threshold.
- For male lone parents: 15% of First Nations, 7% of Inuit, 22% of Métis and 17% of non-Indigenous male lone parents in 2016 are living below the MBM threshold.
- Total lone parents: 26% of First Nations, 12% of Inuit, 32% of Métis and 23% of non-Indigenous lone parents in 2016 are living below the MBM threshold.
Source: Statistics Canada, Census of Population, 2016, Census 2016: Lone parent profile by immigrant status and Indigenous identity, Canada - Community accounts and Census 2016: Lone parent families in low income profiles by Indigenous identity, Canada - Community accounts. Custom tabulation prepared by the Newfoundland & Labrador Statistics Agency, Government of Newfoundland and Labrador, 2019.
- Date modified: